
The science behind our three inflections, and why the trajectory is worth changing
Ageing can narrow your life long before it produces a diagnosis. Recovery takes longer. The demanding week costs more. Strength and stamina slip, and activities that once felt ordinary begin to require planning.
We adjust. We lower our expectations. Eventually, we call the smaller life normal.
At LONGEVITY, we challenge that acceptance. Our trajectory chart is built from evidence. This is how we drew it.
Reading the chart
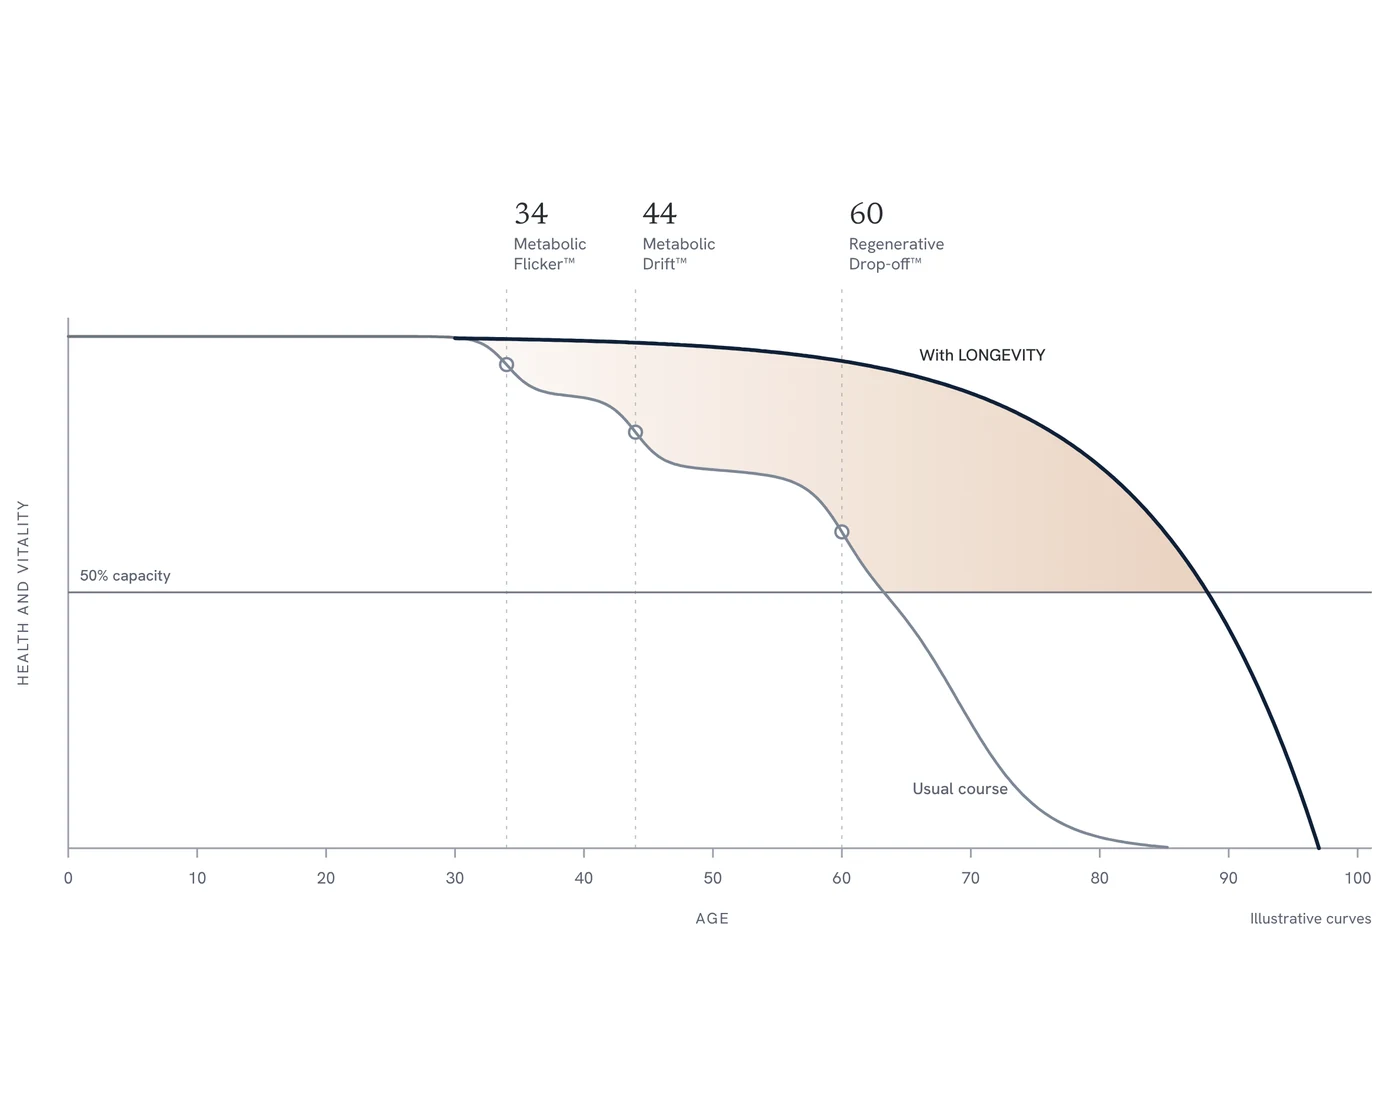
The vertical axis is health and vitality: strength, aerobic capacity, metabolic control, cognition and resilience, taken together. In practical terms, what your body lets you do.
The grey line is the usual course shown in our chart. It steps down through the three inflections and crosses the 50% capacity line at about 63.
The healthspan problem is visible in national data. In England, ONS estimates for 2022–2024 put healthy life expectancy at 60.9 years for men and 61.3 for women, against life expectancy of 79.4 and 83.3 years respectively. That leaves a gap of approximately 19–22 years in less than good health. [1,2]
That is the gap our approach addresses. Extending the years in which people retain strength, clarity and independence is a clinical priority in its own right.
The navy line is the trajectory we work towards: sustained capacity, a later crossing at about 88, and a shorter decline at the end. Both lines reach zero. Our objective is to live well for longer and compress substantial ill health into a smaller part of life. [3]
The difference between those crossings is roughly 25 years. That is the question the chart puts in front of us. The cognac shading shows what is at stake: more capacity sustained across more years, keeping a larger life within reach.
Why the curve changes pace
Ageing draws together changes in energy production, metabolic regulation, inflammation, protein maintenance and tissue repair. These processes interact, their consequences accumulate, and the pace of decline accelerates as reserve is lost.
Large-scale molecular studies have brought that changing pace into view. Lehallier and colleagues measured nearly 3,000 blood proteins in more than 4,000 adults, identifying waves of change around 34, 60 and 78. Shen and colleagues subsequently reported multi-omic shifts around 44 and 60. [4,5]
Our chart brings those molecular findings together with the wider biology of ageing. We call the three inflections Metabolic Flicker™, Metabolic Drift™ and Regenerative Drop-off™. Together, they describe a progression from early metabolic vulnerability, through accumulating dysregulation, to declining repair and recovery.
Around 34: Metabolic Flicker™
Metabolic Flicker describes early biological change beneath preserved everyday performance. You still meet the demands of life, but the reserve behind that performance is beginning to erode.
Human muscle studies show declining mitochondrial ATP-production capacity alongside increasing oxidative damage. Epigenetic differences accumulate across life, changing how the same genetic instructions are expressed. These are the foundations of our first inflection: cellular energy and regulation changing before substantial functional loss becomes obvious. [6,7]
Insulin sensitivity belongs in this picture too. Body composition and physical activity strongly influence it. Metabolic deterioration develops before diabetes appears, giving us an opportunity to recognise it and intervene early. [8]
Flicker is the time to establish a baseline, identify emerging metabolic strain and build reserve. Strength, fitness and metabolic health are assets worth developing early.
Around 44: Metabolic Drift™
Through midlife, the pressures reinforce one another. Visceral fat increases, hormonal signalling changes, inflammatory regulation becomes less favourable, and maintaining fitness and muscle requires deliberate attention.
The menopause transition provides a clear human example. Longitudinal studies show accelerated fat gain, loss of lean mass and increased visceral fat. Body composition can change substantially without a dramatic change on the scales. [9,10]
Ageing is accompanied by rising inflammatory markers, with cardiovascular risk and disease contributing to the pattern. Biology, behaviour and illness reinforce one another. [11]
This is what we mean by drift: several modest changes accumulating into a less resilient system. Mitochondrial dysfunction sits within that network, connecting our interest in cellular energy with metabolic health, stress responses and repair. [12]
Our task is to identify what is driving the drift, address the causes and restore capacity before the losses become established limitations.
Around 60: Regenerative Drop-off™
Loss of reserve makes setbacks more expensive. Illness, injury and inactivity consume capacity, while rebuilding demands more time and effort. Recovery becomes central to maintaining independence.
Immune ageing reshapes defence and regulation. Longitudinal human research reveals distinct individual trajectories of immune change. Following that biology over time gives us a more useful understanding than age alone. [13]
Muscle illustrates the connection between maintenance and repair particularly well. Human biopsy studies show fewer satellite cells—the stem cells supporting muscle adaptation—alongside age-related shrinking of fast-twitch muscle fibres. The machinery for rebuilding is changing as well as the tissue it maintains. [14]
Stem-cell exhaustion, sarcopenia, immune ageing and declining mitochondrial capacity give this third inflection its biological identity. Regenerative Drop-off describes the increasing pressure on the systems that maintain and repair us. [12]
This is a call to defend function: muscle, aerobic reserve, metabolic and vascular health, and a deliberate plan for recovery when setbacks occur.
Changing the trajectory
The biology remains responsive. Twelve weeks of interval training improved muscle mitochondrial respiration in older adults and reversed many age-associated differences in their muscle proteome. Resistance training increased satellite-cell content and muscle-fibre size. These are measurable improvements in energy production and the machinery of repair. [14,15]
Continuous medicine turns that responsiveness into a sustained clinical approach. We measure, interpret, act and measure again. We connect symptoms, biomarkers and physiology with strength, fitness and everyday function, then follow the response and refine the plan.
Greater reserve keeps more of life available: work, travel, learning, family and independence. Our purpose is to preserve that capacity, restore it where possible, and sustain it for longer.
What would you do with 25 more years in good health?
That question is why we pay attention to the curve early—and keep paying attention.
References
1. Office for National Statistics. Healthy life expectancy, UK: between 2011 to 2013 and 2022 to 2024. Released 19 February 2026. England estimates. https://www.ons.gov.uk/peoplepopulationandcommunity/healthandsocialcare/healthandlifeexpectancies/bulletins/healthstatelifeexpectanciesuk/between2011to2013and2022to2024
2. Office for National Statistics. National life tables – life expectancy in the UK: 2022 to 2024. Released 10 December 2025. England estimates. https://www.ons.gov.uk/peoplepopulationandcommunity/birthsdeathsandmarriages/lifeexpectancies/bulletins/nationallifetablesunitedkingdom/2022to2024
3. Fries JF. Aging, natural death, and the compression of morbidity. New England Journal of Medicine. 1980;303:130–135. https://doi.org/10.1056/NEJM198007173030304
4. Lehallier B et al. Undulating changes in human plasma proteome profiles across the lifespan. Nature Medicine. 2019;25:1843–1850. https://doi.org/10.1038/s41591-019-0673-2
5. Shen X et al. Nonlinear dynamics of multi-omics profiles during human aging. Nature Aging. 2024;4:1619–1634. https://doi.org/10.1038/s43587-024-00692-2. Source note: an editor’s notice dated 15 July 2026 flags questions about the reliability of some peak-detection analyses.
6. Short KR et al. Decline in skeletal muscle mitochondrial function with aging in humans. PNAS. 2005;102:5618–5623. https://doi.org/10.1073/pnas.0501559102
7. Fraga MF et al. Epigenetic differences arise during the lifetime of monozygotic twins. PNAS. 2005;102:10604–10609. https://doi.org/10.1073/pnas.0500398102
8. Karakelides H et al. Age, obesity, and sex effects on insulin sensitivity and skeletal muscle mitochondrial function. Diabetes. 2010;59:89–97. https://pubmed.ncbi.nlm.nih.gov/19833885/
9. Greendale GA et al. Changes in body composition and weight during the menopause transition. JCI Insight. 2019;4:e124865. https://doi.org/10.1172/jci.insight.124865
10. Lovejoy JC et al. Increased visceral fat and decreased energy expenditure during the menopausal transition. International Journal of Obesity. 2008;32:949–958. https://doi.org/10.1038/ijo.2008.25
11. Ferrucci L et al. The origins of age-related proinflammatory state. Blood. 2005;105:2294–2299. https://doi.org/10.1182/blood-2004-07-2599
12. López-Otín C et al. Hallmarks of aging: An expanding universe. Cell. 2023;186:243–278. https://doi.org/10.1016/j.cell.2022.11.001
13. Alpert A et al. A clinically meaningful metric of immune age derived from high-dimensional longitudinal monitoring. Nature Medicine. 2019;25:487–495. https://doi.org/10.1038/s41591-019-0381-y
14. Verdijk LB et al. Satellite cells in human skeletal muscle; from birth to old age. Age. 2014;36:545–557. https://doi.org/10.1007/s11357-013-9583-2
15. Robinson MM et al. Enhanced protein translation underlies improved metabolic and physical adaptations to different exercise training modes in young and old humans. Cell Metabolism. 2017;25:581–592. https://doi.org/10.1016/j.cmet.2017.02.009
